

 PROCHECK sample plots


 PROCHECK sample plots

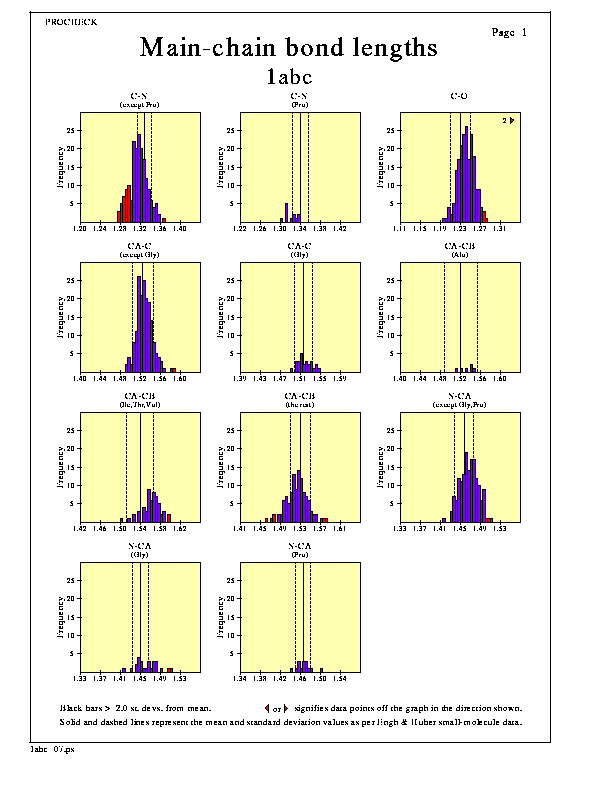
The histograms on this plot show the distributions of each of the different main-chain bond lengths in the structure. The solid line in the centre of each plot corresponds to the small-molecule mean value, while the dashed lines either side show the small-molecule standard deviation, the data coming from Engh & Huber (1991).
Highlighted bars correspond to values more than 2.0 standard deviations from the mean, though the value of 2.0 can be changed by editing the procheck.prm file.
If any of the histogram bars lie off the graph, to the left or to the right, a large arrow indicates the number of these outliers (as in the C-O plot above).
Significant outliers are shown on the Distorted geometry plots.
The main options for the plot are:-
These options can be altered by editing the parameter file, procheck.prm, as described here.


 PROCHECK sample plots