

 PROCHECK sample plots


 PROCHECK sample plots

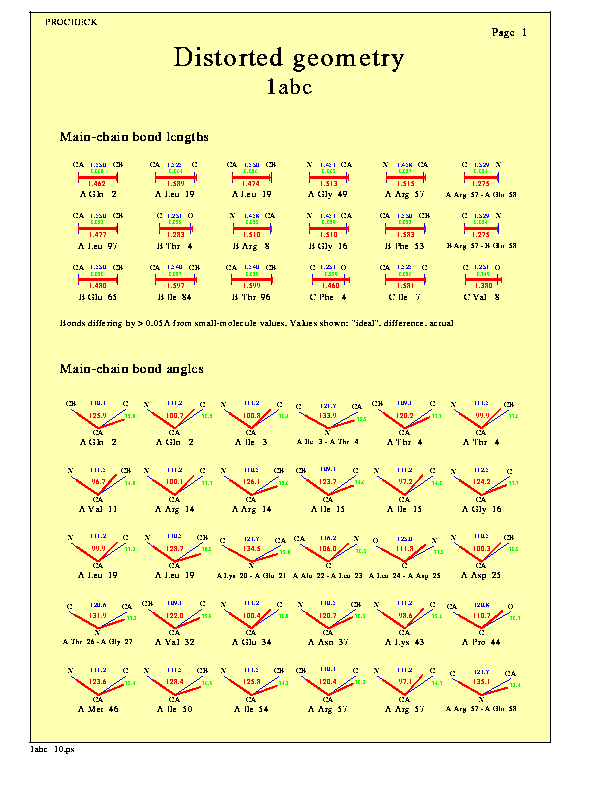
These plots shows all distorted main-chain bond lengths, main-chain bond angles, and planar groups.
The parameters defining how distorted these properties need to be before being plotted here are given in the procheck.prm parameter file.
For each main-chain bond length and angle plotted, the plot shows the ideal value (as defined by the Engh & Huber small-molecule data), the actual value, and the difference between the two.
For each distorted planar groups, three orthogonal projections are plotted and the value shown is the RMS distance of the atoms from the best-fit plane.
The main options for the plot are:-
These options can be altered by editing the parameter file, procheck.prm, as described here.


 PROCHECK sample plots