

 PROCHECK sample plots


 PROCHECK sample plots

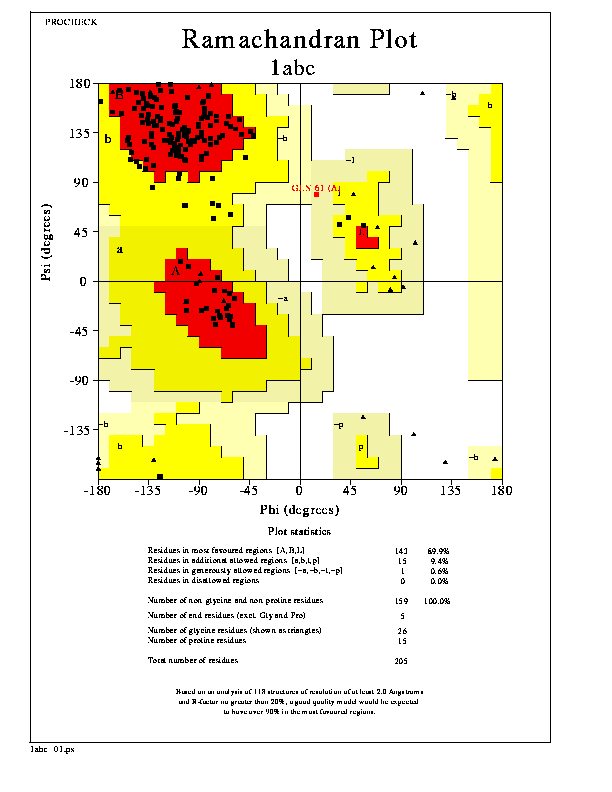
The Ramachandran plot shows the phi-psi torsion angles for all residues in the structure (except those at the chain termini). Glycine residues are separately identified by triangles as these are not restricted to the regions of the plot appropriate to the other sidechain types.
The colouring/shading on the plot represents the different regions described in Morris et al. (1992): the darkest areas (here shown in red) correspond to the "core" regions representing the most favourable combinations of phi-psi values.
Ideally, one would hope to have over 90% of the residues in these "core" regions. The percentage of residues in the "core" regions is one of the better guides to stereochemical quality.
Note that additional Ramachandran plots can also be generated, as follows:-
The main options for the Ramachandran plot are:-
These options can be altered by editing the parameter file, procheck.prm, as described here.


 PROCHECK sample plots